Examining the predictive value of Evalex20

At Evalex we do continuous research into the psychometric properties of our full range of assessment systems. What follows is a report on one of our research projects. This one examines the predictive validity of the Evalex20 behavioural system.
The reason why most organisations choose to do some form of assessment (be it cognitive, personality, EQ, business competencies or any other construct) is to assess the probability that the person they wish to appoint or promote will perform well. Indeed, that this person will turn out to be a high performer or will advance in their career.
It follows then that any form of assessment must have predictive validity. What is meant by predictive validity is for the tool or instrument results to correlate highly with an index of performance. Any criterion can be used, but the most frequently are Performance, Position Level or Career Advancement. Evalex has developed a methodology called High/Low Studies to calculate the predictive validity of the EvaleX20 behavioural assessment system.
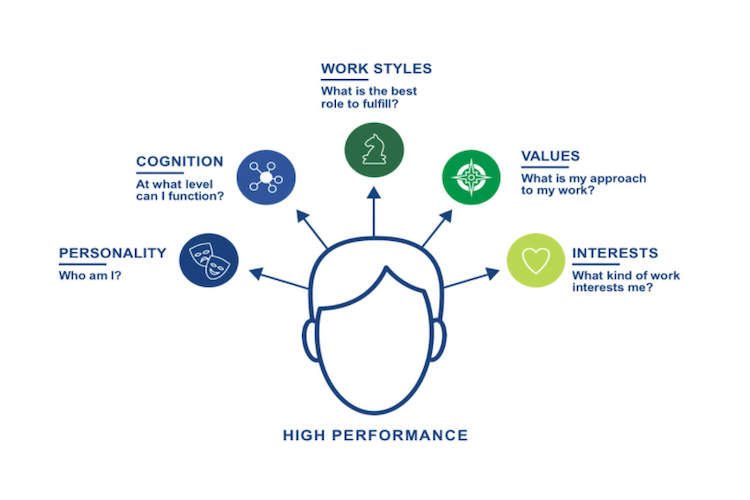
It is known that certain traits or characteristics determine successful performance in a given position. Conversely, the characteristics determining successful performance is unique to a specific position type and the characteristics defining performance in this position may not necessarily define performance in another position. In fact, what our research indicates is that a constellation of traits or characteristics usually predict successful performance for most positions. The individuals who seem to be successful in a particular role are those where the combination of personality traits, management/work styles, cognitive functioning, values and interests come together in the constellation required by the position.
This is where the High/Low study concept comes into its own: It can define this unique constellation for any position under discussion.
For a particular position type, such as claims assessors in an insurance industry, travel consultants in the travel industry, business bankers, tellers or customer service consultants in banking, restaurant managers in the hospitality industry, field marketing executives in the cellular telephony industry, a sample of high performers is identified as well as an opposing sample of low performers. Average performers are discounted.
Once a group of employees in a particular role has been assessed through Evalex20, management compiles a list of the high and low performers based on agreed upon performance indicators that are objective and measurable. Between three and five indicators are advised and each must be measurable or where subjective, the majority of the management team must agree to it being high or low. Examples are: New customer acquisition numbers, client retention numbers, number of transactions processed per day, sales figures, claims figures and other more strategic indicators.
The high performing group’s results across all dimensions assessed are then averaged and the same is done for the low performing group. The two profiles are super-imposed to highlight the differentiating dimensions. Having done more than 50 such studies, on average 20 to 30 differentiating dimensions are usually found. Only those that show a statistical significant difference between the two groups remain. Some correlate positively and others negatively. For each group, the positive correlating factors are summed and averaged. The same is done for the negative correlating dimensions. The negative average is then subtracted from the positive average. This results in a Net Average Score per group. Usually a range between -20 to +20 is found. An acceptable cut-off between these is defined. Call this the “cut-off threshold” between high and low performers (usually the midpoint).
At this point the accuracy with which the assessment battery (Evalex20) would have predicted the high and the low performers needs to be determined.
This is done by doing the same calculation on an individual level, then simply calculating how many high performers score above the cut-off-threshold as a proportion of all high performers and conversely, how many low performers score below the cut-off-threshold as a proportion of the low performers.
Research Methodology
The results of 32 such studies were combined. This involved 894 employees across 32 position types.
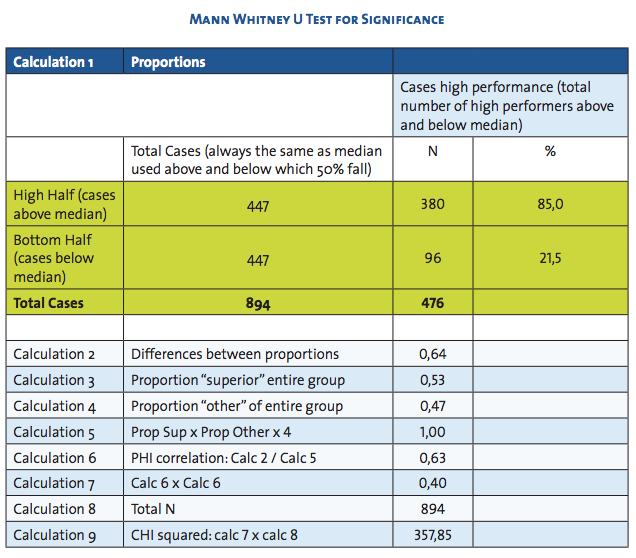
Once combined the Mann-Whitney-U statistical formula was applied to calculate the significance of differences between the two groups as well as the correlation coefficient.
The Mann-Whitney U test (also called the Mann-Whitney-Wilcoxon (MWW) or Wilcoxon rank-sum test) is a non-parametric (arbitrary sample sizes) statistical hypothesis test for assessing whether one of two samples of independent observations tend to have larger values than the other. It is one of the most well-known non-parametric significance tests by Henry Mann and his student Donald Ransom Whitney. It is particularly useful where the criterion score (in this case Performance) is dichotomous (high-versus-low) rather than ordinal (according to a continuum of performance) and where the sample sizes are small. Findings Two calculations were done. The first, calculating the Mann-Whitney-U per group or position type. The second, calculating some sort of average across all studies. This second calculation is not the purist, yet gives some indication of predictive validity across all 32 studies.
The calculations for each individual study (intra-group) of the 32, were within a range of 0,59 to 0,66, with the average being 0,63.
A correlation of 0,63 in psychometric research is extremely high and confirms the ability of EvaleX20 to predict future performance. The important conclusion is that Evalex20 assessment system consistently predicted performance in each and every one of the 32 studies.
In every one of the 32 studies, the client company indicated who the high and low performers were. The client company had access to the Evalex system and could draw the reports of these individuals and average the scores themselves to ensure accuracy. The respective management teams in all 32 cases met and the detailed results were presented in Excel format and the calculations verified by them, particularly that the high performers were indeed high performers and the low performers were indeed low performers. They then participated in defining the cut-off-threshold and calculating how many high/low performers scored above and below this threshold.
Results
The results of all 32 studies were combined and the outcome of the combination is seen in the table below. The table below follows the different steps in the calculation of the Mann-Whitney-U test for significance.
More research findings are available on our Research Papers page.