Assessing Workplace Deviance in Entry-level Workers – Is it worth it: Proving Return on Investment of Implementing a Robust Recruitment Process at the Front Line
A quick scan of management studies and articles in popular media will yield claims that 95% of companies report workplace deviance in their organisation, and up to 75% of employees have been shown to engage in deviant behaviours such as theft, absenteeism, or sabotage.
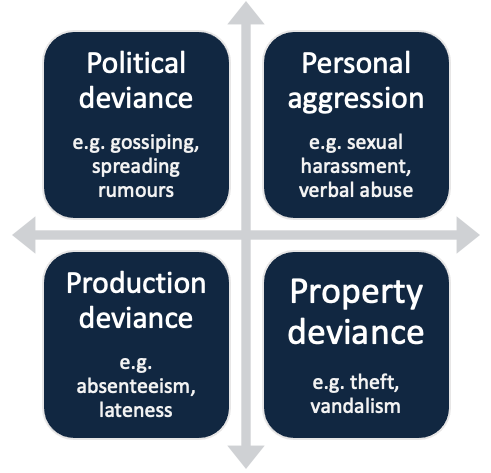
This points to a new construct we like to think of as Workplace Deviance. Workplace Deviance consists of a range of voluntary behaviours that violate company norms and are typically targeting individuals in organisations or the organisation itself. Irrespective of the target, workplace deviance has a pervasive impact on organisational success and culture. One way to look at deviance is to plot the seriousness of the deviant acts on the vertical access and the target of the deviant behaviour on the Y axis:, and can be plotted on a graph as follows:
The question is, how important is this construct and how well does it predict deviant behaviour or even higher job performance? Linked to this is another very pertinent question – is it worthwhile for companies to invest in robust recruitment processes that utilise tools that predict the propensity to engage in Workplace Deviance? This is a pertinent question when selecting unskilled and semi-skilled workers at large volumes since the cost of assessment can become high.
We made it our mission to investigate these questions, by conducting an in-depth research study on the importance of workplace deviance on job success in a range of semi-skilled pickers and packers.
One of our clients in the Functional Outsourcing sector made data on productivity, idle time, disciplinary actions, and packing errors available to us on a sample of 65 of their employees.
We were first interested in evaluating how much employees vary in terms of their performance and workplace deviance. To do this we selected the 10 employees with the most disciplinary actions to their names as ‘Extreme Offenders’ and selected the 10 employees with no offences with the longest tenure at the company as ‘Model Employees’. The ‘Average Employee’ is an aggregate of the entire 65-employee sample.
We were able to verify that the average employee picks 55 products per hour, is absent one day for every five months, makes one error every 10 months, and commits an offence once every four years. In contrast to the average employee, the model employee picks 81 products per hour, is absent one day for every 10 months, makes one mistake every three years, and never commits any serious offences. The extreme offender on the other hand only picks 48 products per hour, is absent one day every three months, makes one error every eight months, and commits an offence once a year.
This data suggests that the model employee outperforms the typical employee by 47% and the extreme offender by 68%. In addition, the model employee is 4.3 times less likely to make a mistake, and three times less likely to be absent when compared to extreme offenders. While model employees commit no offences, the extreme offender commits four times the offences of an average employee.
Given that the Dynamic Risk Assessment (DRA) is a gamified, non-verbal situational judgment test that aims to identify extreme offenders and individuals with a tolerance to challenge rules and norms, we were interested to see if the measure can discriminate between extreme offenders and typical employees in the organisation.
We grouped these employees into high and low-risk groups depending on whether their risk score was above or below the group average. Analysing the performance and deviance data for these 65 employees across these groups yielded some very interesting trends. A summary of the results is presented in the table below:
In Summary: Full Sample
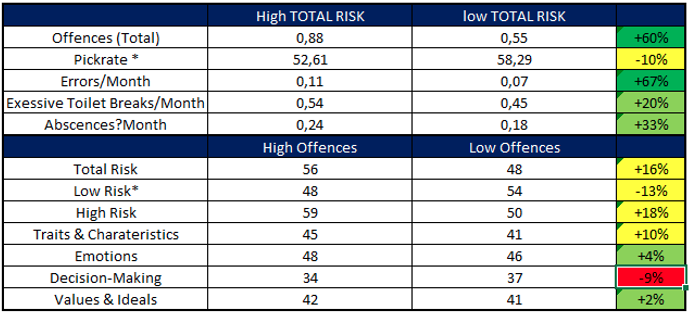
In the full sample, there is a meaningful relationship between almost all of the DRA scores and the performance of the individuals making up the sample. On average employees with a high number of recorded offences scored 16% higher on the overall Total Risk score compared to employees with no offences (or low level of offences). There is also a 13% difference in the Low-Risk score (where a higher score is a better result) between individuals with a high number of recorded offences compared to individuals with a low number of offences. The same general trend is true for High Risk, where individuals with a high number of offences scored 18% higher on the high-risk score compared to individuals with a low number of offences.
In Summary: Full Sample
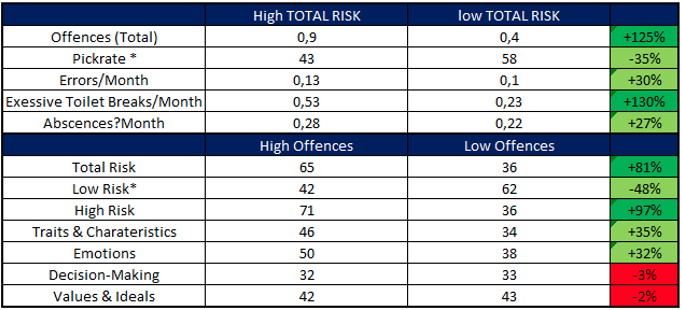
When the top 10 performers in the sample are compared to the bottom 10 performers, the overall differences are even more extenuated. Here, clear differences are seen in almost every measure (in terms of Total Risk, the difference jumps to 81%. In terms of Low Risk the difference is 48%. In terms of High Risk, it is 97%. In terms of Traits and Characteristics, it is 35%, and in terms of Emotions it is 32%). What this analysis suggests is that high DRA dimension and total scores are associated with higher levels of offences (+125%), lower levels of productivity (-35%), more errors each month (+30%), more excessive toilet breaks (+130%), and higher absenteeism (+27%).
Thus, we can conclude that there is a substantial difference in the Total Risk score between deviant and non-deviant employees, which can be attributed almost entirely to Trait and Characteristics (35% difference) as well as Emotions-based Risk (32% difference).
Therefore, the DRA could be incorporated in any recruitment process to better predict which candidates are likely to emulate the ‘Model Employees’, and which are more likely to become ‘Extreme Offenders’ later on.
Read part 2 of this article: Calculating ROI for using the DRA